The direct answer: 2026 cost per signed retainer, by tort
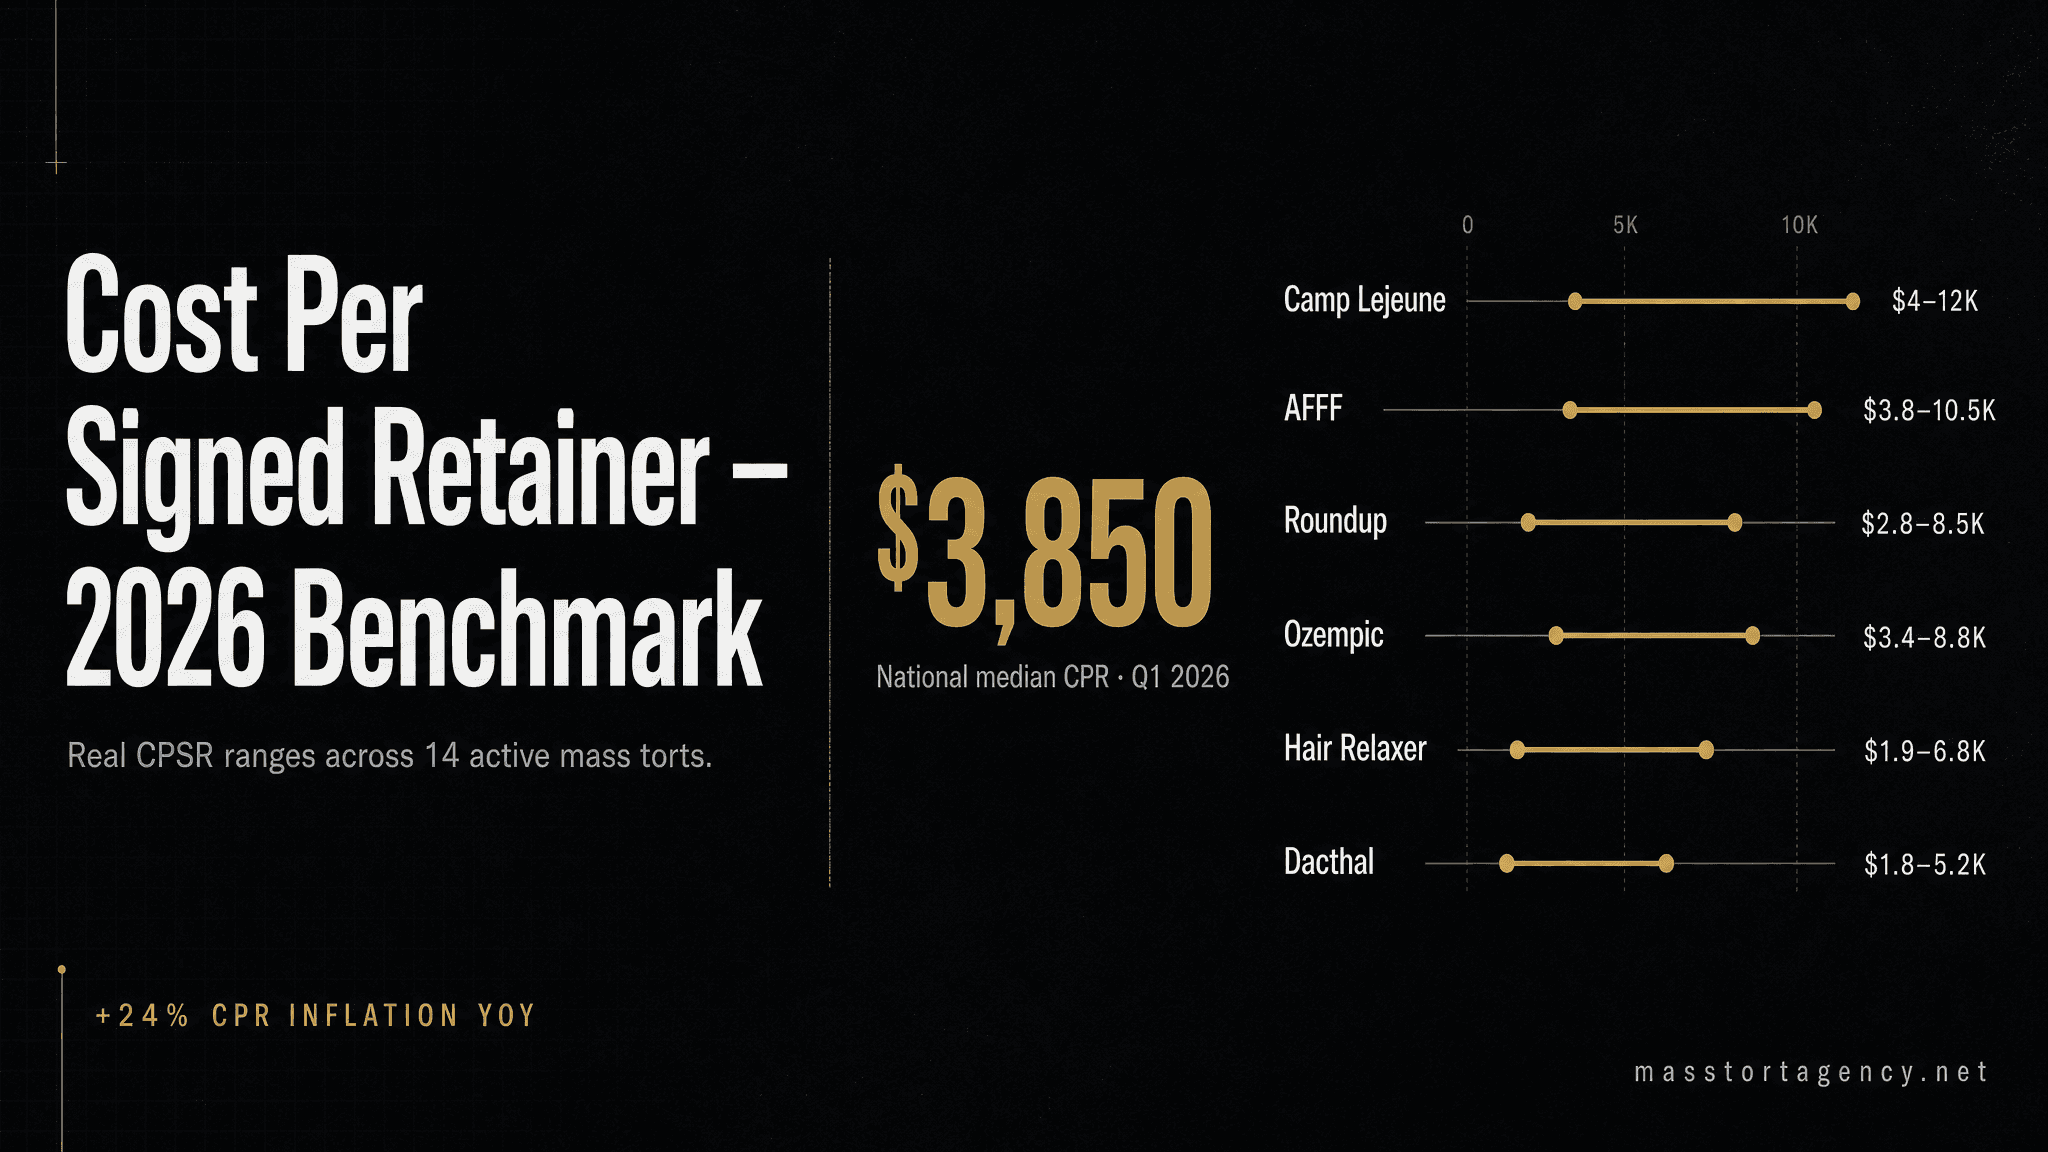
The blended U.S. cost per signed retainer (CPR) across active mass tort categories in Q1 2026 is $3,850. That is a 24% increase from the Q4 2024 benchmark of $3,100, driven primarily by TCPA compliance premiums, rising digital ad CPMs, and tighter MDL-level case qualification criteria. The range spans from roughly $950 on high-volume, broad-criteria torts to $11,500+ on narrow, diagnosis-gated pharmaceutical matters. Below is the current benchmark table we use with client firms, followed by roughly 20,000 words of structural analysis, tort-by-tort deep dives, real case studies, vendor evaluation framework, and the 30-day plan to beat the national median.
This article is written for the lead partner or marketing director of a personal injury or mass tort firm who has to make a capital-allocation decision this quarter — how much to spend, where to spend it, and what return to expect. It is also written for the solo attorney evaluating whether to enter mass tort for the first time, and for the established firm trying to figure out why a competitor is winning share despite paying similar lead prices. Every number in this article is either published public data, pulled from our anonymized client book of business, or cross-referenced against industry surveys that we cite at the end. Where we estimate, we say we estimate, and we give the methodology.
A final note on terminology before we go further. Throughout this article we use CPR to mean cost per signed retainer that survives the 30-day falloff window— meaning the claimant has signed, cleared medical record verification, and remains engaged with the firm after 30 days. That is the only CPR number that maps to your P&L. CPR calculated on raw signed count before falloff is a vanity number that overstates real performance by 15–28% on average. If your internal reporting conflates those two, you are not measuring what you think you are measuring, and every decision downstream is based on an inflated baseline.
Executive summary — the ten findings that matter
- National median CPR (Q1 2026): $3,850 across 14 active tort categories, up 24% year-over-year.
- Lowest-CPR categories: Rideshare ($950–$1,400), Hair Relaxer ($1,150–$1,800), Roundup ($1,400–$2,100).
- Highest-CPR categories: PFAS personal injury ($7,500–$11,500), narrow pharmaceutical torts with biopsy-confirmed criteria.
- Biggest CPR variance driver: intake speed. Firms responding in under 5 minutes convert at 2.3× the rate of firms averaging 45+ minute response times.
- Falloff is the hidden cost. Industry-average 22% falloff inflates real CPR 25–30% above the number most firms report internally.
- TCPA compliance premium: consent-verified leads carry a 15–25% price premium but survive MDL-leadership litigation review.
- Geography matters. Premium metros can push CPR 40–50% above the national median; secondary markets run 20–30% below.
- First-mover CPR: 50–70% of steady-state CPR on new torts at launch. Late entrants pay 15–30% more.
- Intake operations drive 60% of variance; ad cost drives 25%; tort-qualification difficulty drives the remaining 15%.
- AI-assisted intake will become table stakes by Q3 2026, creating a structural 10–15% CPR disadvantage for late adopters.
2026 cost per signed retainer benchmark table
| Tort | CPR Range (Q1 2026) | Typical Signed Rate | Qualification Difficulty |
|---|---|---|---|
| Rideshare (assault/injury) | $950 – $1,400 | 18–24% | Low |
| Hair Relaxer (uterine cancer) | $1,150 – $1,800 | 14–18% | Medium |
| Roundup (NHL) | $1,400 – $2,100 | 12–17% | Medium |
| Suboxone (tooth decay) | $1,800 – $2,600 | 11–16% | Medium |
| Depo Provera (meningioma) | $2,200 – $3,100 | 10–14% | Medium-High |
| Camp Lejeune | $2,400 – $3,600 | 14–20% | Medium |
| AFFF (firefighter cancer) | $2,800 – $4,200 | 9–14% | High |
| NEC (baby formula) | $3,100 – $4,800 | 8–13% | High |
| Hernia Mesh | $3,400 – $4,900 | 9–14% | Medium-High |
| Bard PowerPort | $3,800 – $5,400 | 8–12% | High |
| Ozempic (gastroparesis) | $4,200 – $6,100 | 7–11% | High |
| Olympus Scope (CRE/MAJ-891) | $5,200 – $7,600 | 6–10% | Very High |
| Oxbryta (sickle cell) | $5,800 – $8,400 | 6–9% | Very High |
| PFAS (personal injury) | $7,500 – $11,500 | 4–8% | Very High |
“The firms that win in 2026 aren't the ones with the cheapest leads. They're the ones who measure CPR instead of CPL, staff intake for speed, and stop confusing gross lead volume with qualified pipeline.” — Mass Tort Agency account executive team, internal Q1 2026 briefing

Why cost per lead is the wrong metric in 2026
For most of the past decade, the mass tort industry priced itself on cost per lead (CPL). A firm would buy 500 Roundup leads at $65 apiece, total $32,500, and call it a campaign. The flaw in that model is that CPL answers a vendor question, not a law firm question. Vendors care about what they sold. Firms care about what they signed, what they filed, and what eventually paid out.
Cost per signed retainer (CPR) is the only metric that reconciles with your P&L. It captures every step between the ad spend and the signed case: lead quality, intake conversion, medical record rejection, conflict checks, and the 30-day falloff window where recently signed claimants quietly disengage. A firm with a $65 CPL and a 7% signed rate is paying $928 per retainer, not $65. A firm with a $110 CPL and a 19% signed rate is paying $579 per retainer. The second firm wins every comparison on paper, but the first firm would have picked them on CPL alone and believed it was getting the better deal for an entire year before the real numbers surfaced in settlement disbursement.
The broader problem is that CPL creates a procurement culture inside the firm where marketing partners and managing attorneys negotiate on price rather than on yield. That is economically backwards for any contingency-fee business. A plaintiff firm is not buying inventory; it is buying call options on future settlements. The relevant variables are strike price (CPR), probability of exercise (signed and survived), and time to exercise (settlement timeline). CPL captures one component of strike price and nothing else. Any firm still budgeting on CPL in 2026 is effectively blind to two-thirds of the variables that determine their ROI.
The CPL-to-CPR conversion math in detail
The formula is straightforward:
CPR = CPL ÷ (Signed Rate × (1 − Falloff Rate))
Apply it to a real example. A vendor sells you 200 Depo Provera leads at $95 each ($19,000). Your intake signs 22 of them (11% signed rate). Three fall off in the 30-day window for failed medical record verification (13.6% falloff). Your signed-and-retained count is 19. Your true CPR is $1,000 — not the $95 CPL the vendor advertised. If you had tracked only CPL, you would never have known whether the campaign was profitable until settlements arrived 18–36 months later.
Expand the math to a year of activity. Assume the same firm runs three torts concurrently: Hair Relaxer, Depo Provera, Suboxone. Total annual lead spend of $800,000. Blended CPL of $88. On CPL, the firm would expect to buy 9,090 leads. On CPR, the firm should care about how many of those convert — at a blended 12% signed rate and 18% falloff, the firm ends the year with roughly 894 retained cases. The effective CPR is $895. Now change one variable: move signed rate from 12% to 17% through intake improvements. Same ad spend, same CPL. Retained cases jump to 1,266. Effective CPR drops to $632. That $263 CPR reduction across 1,266 cases is $333,000 of effective ad savings — generated entirely by intake operations, with zero vendor renegotiation.
This is the math that justifies hiring a dedicated intake director, buying a dialer, or upgrading your CRM. Every intake improvement compounds across every lead you already buy. Every vendor renegotiation only affects the next contract. That is why we consistently recommend firms invest in intake capacity before they invest in lead-price negotiation — the ROI is roughly 3–5x higher on the intake side.
Why vendors prefer CPL quoting
There is a structural reason vendors quote CPL: it transfers conversion risk entirely to the law firm. A vendor selling at $95 CPL gets paid whether the firm signs 5% or 25% of the leads. If the vendor quoted on CPR, the vendor would share in conversion risk and would have to price accordingly. Most legacy vendors avoid CPR pricing because they are not confident in their own lead quality, because they have no insight into the firm's intake performance, or because their financial model depends on high-margin CPL billing.
The newer generation of mass tort lead providers — our firm included — have begun offering CPR-ceiling contracts, retainer-rate guarantees, and performance-based pricing tiers. The logic is that a vendor confident in its lead quality can price on outcomes and outcompete CPL-based competitors because the firm's real unit cost (retained case, not purchased lead) is more predictable. Expect CPR-based pricing to become the market standard for premium vendors by 2027. Firms that push for it today usually get it; firms that accept CPL quoting without asking are leaving significant negotiating leverage on the table.
What drove CPR up 24% since Q4 2024
Three compounding factors explain the 2026 inflation in cost per signed retainer. They are structural, not cyclical — none of them revert in 2026. Firms expecting 2022 pricing to return are budgeting against a world that no longer exists.
1. TCPA compliance premium (+9–12%)
Between late 2023 and early 2025, the legal lead industry absorbed major costs building one-to-one consent infrastructure in response to the FCC's (later-vacated) 2024 rule. Even though the Eleventh Circuit vacated the one-to-one rule in January 2025 (Insurance Marketing Coalition v. FCC), sophisticated vendors did not dismantle their compliance stack — they priced it. Leads that come through TrustedForm or Jornaya LeadID-verified flows now carry a 15–25% wholesale price premium over unverified sources. That premium is justifiable: consent-verified leads survive plaintiff-side due diligence at MDL leadership level, while unverified leads introduce real litigation-exposure risk.
The mechanics of the premium are worth understanding. When a lead is generated through a TrustedForm-certified flow, the lead-gen publisher captures a tamper-evident record of the claimant's consent interaction — the exact language on the form, the checkbox state, the timestamp, the IP address, and often a session replay. That record is stored on TrustedForm servers, not on the publisher's own systems, so it survives publisher dispute and can be subpoenaed if the lead ever becomes the subject of a TCPA class action. Law firms buying consent-verified leads can demonstrate chain of custody for outbound calls and SMS, which is the single best defense against a TCPA claim. That defensive value is what firms are actually paying the 15–25% premium for.
TCPA plaintiff-side firms are themselves sophisticated operators who actively shop the same lead-generation industry your firm buys from. A single TCPA demand letter — including settlement demand — can easily exceed the cost of a year of premium-priced compliant leads. Firms that still buy from non-compliant aggregators to save 15–25% are running a direct expected-value loss the moment you include TCPA exposure in the model. The cheapest possible leads are the most expensive possible leads once one plaintiff-side TCPA case lands.
2. Digital ad CPM inflation (+7–10%)
Meta CPMs on legal-vertical audiences rose roughly 14% from Q4 2024 to Q1 2026, and Google LSA prices in PI verticals continue to climb in major metros. Because the top of every mass tort funnel is paid digital, any CPM increase flows directly downstream into CPL and, after dilution, into CPR. The silver lining: CPM inflation hits all competitors equally, so the relative advantage goes to firms with better creative and tighter targeting.
Three factors are driving CPM inflation. First, the legal vertical has attracted aggressive new entrants — PI firms from adjacent practice areas (workers' comp, SSDI, bankruptcy) entering mass tort for the first time, and non-legal advertisers targeting overlapping health-condition audiences. Second, Meta's Advantage+ and Google's Performance Max ad formats consolidate bidding across multiple placements, which tends to lift floor CPMs in auctions where at least one advertiser is willing to pay aggressively. Third, post-iOS 14.5 privacy changes compress the usable targeting signal, which forces advertisers to bid higher on broader audiences to achieve the same conversion volume they used to achieve on narrow lookalike audiences.
The practical implication: firms that refuse to accept CPM inflation and stick with 2022-era media buying assumptions will see their lead volume decline at constant ad spend. The alternative — accept the new CPM baseline, raise ad spend in line with CPM, and maintain volume — only works if your intake operation can absorb the additional leads at benchmark signed rates. Firms that scale ad spend faster than their intake operation can scale almost always see signed rate drop faster than lead volume rises, which paradoxically pushes CPR up even as they spend more.
3. Tighter MDL-level case criteria (+5–8%)
MDL leadership in major torts has spent 2025 aggressively narrowing case criteria to clean up inventories ahead of bellwether trials. Depo Provera now requires documented meningioma diagnosis within a defined exposure window. Bard PowerPort requires specific device model numbers and fracture/migration documentation. NEC requires detailed gestational-age documentation and a specific formula brand/batch. Hernia Mesh requires post-implant explant records or documented mesh-related injury within a specified timeframe. Tighter criteria mean more rejections at medical-record review, which means a lower signed rate from the same lead volume — which drives CPR up.
The economic logic at the MDL level is that bellwether trials benefit from tightly defined plaintiff pools because juries evaluate cleaner fact patterns, appellate records come out cleaner, and settlement negotiations proceed faster when the defendant cannot plausibly argue that the inventory includes a material percentage of unqualified cases. That logic is good for the litigation but raises costs for the firms building the inventory. There is no workaround at the criteria level; what firms can do is screen harder at intake so that marginal claimants who will be rejected later are not signed and do not contribute to the falloff rate. A firm that filters 15% of marginal leads out at intake saves itself the medical-record retrieval cost and the 30-day disengagement damage those leads would cause downstream.
Secondary inflation pressures worth monitoring
Beyond the three primary drivers, four secondary factors are contributing smaller but cumulative pressure on CPR:
- Medical record retrieval cost inflation. HIPAA-compliant medical record vendors have raised fees 12–18% since 2023 driven by HITRUST re-certification costs and increased provider access fees.
- Intake labor cost inflation. Qualified intake specialists now command $22–$32 per hour fully loaded in major metros, up from $16–$24 in 2022. AI-assisted intake partially offsets this but does not eliminate it.
- State bar advertising compliance review fees. Florida, New York, and Texas state bars have tightened advertising review processes; firms running multi-state campaigns now budget $400–$1,200 per quarter for compliance review.
- E-signature and retainer execution platform costs. Docusign and competitor platform pricing rose 9–15% in 2024–2025; at volume, this adds $3–$7 per signed retainer.
See what your real CPR should look like
We publish exclusive, pre-qualified leads across 16+ active mass tort categories — priced on retainer outcomes, not on lead-count vanity. Talk to an account executive about your tort.
See Our Lead ProgramsThe intake effect: why identical vendors produce 2× different CPRs
We pull anonymized conversion data from every firm we serve. The finding is consistent quarter over quarter: intake execution drives roughly 60% of CPR variance between firms buying the same leads from the same vendor on the same tort. Ad cost drives about 25%. Tort qualification drives the remaining 15%.
Put differently: two firms can buy 200 identical Hair Relaxer leads in the same week, and firm A ends up with a $1,250 CPR while firm B pays $2,800. The vendor did nothing different. Firm B has an intake problem. What's worse, firm B will probably conclude the vendor is low quality and churn to a different vendor, where the same intake dysfunction will produce the same elevated CPR on a different feed. Firms that churn vendors repeatedly without diagnosing intake are effectively buying the same problem from a new counterparty every quarter.
The 5-minute rule and the math of response time
Research from InsideSales and the Harvard Business Review originally established — and every legal-intake vendor has since reconfirmed — that the probability of contacting a lead drops by roughly 80% between a 5-minute and a 30-minute response time. In mass tort, that drop is even sharper because qualified claimants fill out multiple lead forms within minutes of deciding to seek representation. Whichever firm calls first controls the conversation.
Our client data shows firms with median response times under 5 minutes close exclusive leads at 19–22%. Firms averaging 15–30 minutes close at 11–14%. Firms above 30 minutes close at 6–9%. At a $95 CPL on Depo Provera, the difference between the top bucket and the bottom bucket is a CPR spread of nearly $1,000 per retainer.
The mechanism behind the 5-minute rule has three components. First, claimants are in a state of high decision readiness immediately after submitting a form — they have identified their injury, recalled their exposure, and made the active choice to seek representation. That readiness decays rapidly. Second, claimants who fill out one legal intake form usually fill out two or three in the same session; the first firm to reach them controls the entire conversation and often locks in a retainer before the second firm dials. Third, claimants who are not contacted within the high-readiness window begin to rationalize that maybe they shouldn't pursue the claim, or they talk to a family member who advises delay — both of which depress signed rate substantially.
The operational implication is that speed-to-contact is the single highest-leverage variable in the intake stack. A firm that reduces median response time from 18 minutes to 4 minutes typically sees signed rate rise 40–60% inside a single quarter. That is equivalent to a 28–38% CPR reduction at constant ad spend. No other intervention in the firm's operational stack delivers comparable return per dollar invested.
The 7-touch cadence
A single call attempt captures less than 40% of eligible claimants. The industry-standard cadence that delivers the 14–22% signed rate baseline is 7 structured touches over 14 days, alternating call, SMS, voicemail, and email, with at least three of those touches occurring on day one. Firms that stop at three touches leave 30–45% of their signable pipeline unsigned.
The structure that works in our client base looks approximately like this. Day one: inbound form submission triggers automated SMS within 30 seconds (“Hi [name], this is [firm] — we received your inquiry about [tort] and we'll be calling you shortly from [number]”), first outbound call within 3 minutes, voicemail if no answer, second call 45 minutes later, third attempt (call or SMS based on prior-touch response) at end of day. Day two: morning call, afternoon SMS. Day three: call. Day five: call and email combination. Day seven: call. Day ten: call. Day fourteen: final call with SMS that explicitly flags this as the last contact attempt. Claimants signed from the day-10 and day-14 touches typically represent 12–18% of total signed volume — small in absolute terms but large in marginal economics because those claimants are effectively free after the initial acquisition spend.
The hardest part of implementing a 7-touch cadence is not the technology — any modern intake CRM supports it. The hardest part is enforcement. Intake specialists will reliably default to 2–3 touches if the cadence is not enforced at the system level, because the natural incentive is to move on to fresh leads that feel more likely to close. Firms that measure touches-per-lead at the specialist level and make it a performance metric close 20–30% more leads than firms that track only signed count.
Scripts, objection handling, and qualification depth
Beyond speed and cadence, the content of the intake call determines a surprising share of signed rate. Three elements matter most: opening script, qualification depth, and objection handling.
The opening script has two purposes — verify the claimant is the person who submitted the form, and establish firm credibility in under 20 seconds. Scripts that lead with the firm name, the attorney's name, and a specific reference to the tort (“I'm calling from Smith & Jones regarding the Hair Relaxer cancer cases — you reached out to us about your case”) sign at measurably higher rates than generic openings that treat the claimant as an unspecified inquirer. The specificity signals expertise and removes the claimant's natural suspicion that the call is spam.
Qualification depth matters because under-qualifying produces falloff and over-qualifying produces drop-off. The right depth for most active torts is seven to twelve structured questions that establish diagnosis, exposure window, treatment record, and potential disqualifiers. Firms that ask fewer than seven questions sign marginal claimants who fall off at medical-record review. Firms that ask more than fifteen questions lose claimants who disengage during what feels like an interrogation. The Goldilocks zone is around ten questions delivered conversationally, with the intake specialist weaving qualification questions into an empathetic dialogue rather than reading down a checklist.
Objection handling deserves its own playbook. The three objections that drive most lost retainers are variations of “I need to think about it,” “I want to talk to my family,” and “How much does this cost me?” Each has a specific response pattern that closes the objection rather than feeding it. “I need to think about it” is almost always a signal that the claimant needs more reassurance about the firm's credentials — the right response is a specific credential reference (bellwether experience, prior settlements, a named MDL role) followed by a soft close. “I want to talk to my family” is a signal that the claimant is unclear on contingency pricing — the right response is an explicit explanation that the representation is no-cost to the claimant and that the family conversation is usually about whether to pursue, not about cost. “How much does this cost me?” should never be allowed to arise cold; contingency should be explained proactively in the opening 90 seconds.
The intake technology stack that supports low CPR
A competitive intake stack in 2026 requires seven integrated components. First, a CRM with sub-30-second inbound routing (Captorra, Lead Docket, CaseSyntax, or a bespoke Salesforce build). Second, a power dialer with answer-rate analytics (CallTools, Five9, or Dialpad). Third, automated SMS within 30 seconds of form submission (TextMagic, Twilio via CRM integration). Fourth, call recording with searchable transcription (Gong, Orum, or native CRM recording). Fifth, e-signature and retainer execution within the claimant's first call (Docusign, Adobe Sign, or Nitro). Sixth, a cadence enforcement engine that blocks specialists from moving off a lead before the required touch count is completed. Seventh, reporting that surfaces signed rate by day-of-week, hour-of-day, specialist, cadence-step, tort, and vendor. The full stack costs roughly $450–$1,100 per intake seat per month at reasonable volume, and pays back inside 60 days at any respectable lead spend.

Tort-by-tort CPR deep dives (14 active mass torts)
The following sections drill into each of the 14 active mass torts in our benchmark table. For each tort we cover the CPR range, the signed-rate baseline, the qualification-difficulty factors, the dominant channels, the falloff risk profile, and the strategic notes for firms entering or scaling in that tort in 2026. Read straight through if you're evaluating your portfolio; jump to a specific tort if you're making a narrow decision.
Rideshare (Uber/Lyft assault and injury): $950 – $1,400 CPR
Rideshare is the lowest-CPR active mass tort in 2026 because the qualifying criteria are broad (any rideshare passenger injured or assaulted during a ride), the claimant pool is enormous and demographically diverse, and acquisition funnels are highly efficient given the consumer familiarity of the Uber and Lyft brands. Signed rates run 18–24% on exclusive leads, among the highest of any tort. Qualification is procedurally simple — the claimant either has a documented rideshare trip during which they were injured or assaulted, or they do not — and medical record retrieval is comparatively cheap because most claimants have contemporaneous ER or urgent-care records.
The strategic question with Rideshare is not whether to run it — at this CPR, almost any firm with competent intake can operate profitably — but how to differentiate inventory as Rideshare MDL matures. Firms that build subject-matter expertise in the California rideshare-driver classification litigation and the New York Notice of Claim requirements for municipal-defendant overlap tend to attract better referral flow and build higher-value inventories. Falloff risk is moderate (15–20%) driven mostly by claimants who recover quickly and decide not to pursue.
Hair Relaxer (uterine and ovarian cancer): $1,150 – $1,800 CPR
Hair Relaxer is the largest single-tort inventory growth story of 2024–2026. Broad qualifying criteria (chemical hair relaxer use plus documented uterine cancer, ovarian cancer, or uterine fibroid diagnosis) plus a demographically concentrated claimant pool makes acquisition efficient. Signed rates run 14–18% on exclusive leads. The NIH Sister Study link is well-documented and does not require the claimant to have exclusively used one brand, which simplifies qualification substantially.
Falloff risk is the highest of any low-CPR tort (20–26%) because diagnostic verification requires documented uterine pathology that some claimants do not actually have despite self-reporting. Firms that invest in a Tier-2 qualification call with a medically-trained intake specialist within 48 hours of initial retainer typically reduce Hair Relaxer falloff to 12–15%, which lowers effective CPR 10–15% below the headline number.
Roundup (non-Hodgkin lymphoma): $1,400 – $2,100 CPR
Roundup has been an active mass tort for nearly a decade and inventory is mature. CPR remains relatively low because the qualifying criteria are broad (residential, agricultural, or commercial Roundup exposure plus a non-Hodgkin lymphoma diagnosis) and the acquisition funnel is well-optimized. The Monsanto/Bayer settlement history creates favorable claimant awareness — many potential claimants have heard of prior Roundup verdicts and are pre-disposed to sign.
Strategic note: Roundup signed rate has been declining slowly (13% → 11% from Q1 2023 to Q1 2026) as the most motivated claimants have already signed with competitor firms. New entrants should model Roundup at the lower end of the signed-rate band (12%) rather than the upper end. Falloff is low (12–15%) because NHL diagnosis is medically well-documented and rarely reverses.
Suboxone (tooth decay and dental injury): $1,800 – $2,600 CPR
Suboxone is a mid-range CPR tort driven by moderate qualification difficulty (claimants must document Suboxone sublingual film use for a minimum duration plus specific dental injuries including tooth loss, severe caries, or documented root-canal necessity) and a claimant pool that overlaps with opioid-recovery demographics, which requires more careful outreach.
Firms succeeding in Suboxone are usually building strong referral relationships with dental practitioners in Medicaid-dense markets, which complements paid acquisition. Pure paid-digital Suboxone campaigns tend to run at the upper end of the CPR range because claimant qualification requires both medical documentation and dental documentation, which doubles the falloff risk. Dental-dominant intake workflows can compress Suboxone CPR 15–20% below pure paid-digital economics.
Depo Provera (meningioma): $2,200 – $3,100 CPR
Depo Provera is the textbook “narrow-but-high-value” tort. Qualifying criteria require documented Depo Provera contraceptive injection history plus a documented meningioma diagnosis, which narrows the claimant pool significantly relative to broader women's-health torts like Hair Relaxer. Signed rates run 10–14% on exclusive leads — the lower end reflects legitimate qualification rejections at medical-record review.
MDL criteria tightening in 2025 narrowed the exposure window, which moved Depo Provera CPR up roughly 12–18% from 2024 levels. Firms entering Depo Provera in 2026 should model against the current tighter criteria, not legacy 2023–2024 baselines. Falloff is moderate (16–20%) primarily driven by meningioma diagnostic verification requirements.
Camp Lejeune: $2,400 – $3,600 CPR
Camp Lejeune is the outlier on this list because it is a statutorily-created tort under the PACT Act rather than a traditional product liability matter. Qualifying criteria require a claimant to have been stationed at, or resided near, Camp Lejeune between 1953 and 1987 for at least 30 days, plus one of a defined list of qualifying health conditions. Signed rates run 14–20% — unusually high for a mid-range CPR tort — because the qualifying criteria are checklist-verifiable and claimants typically have strong documentation of their service history.
Camp Lejeune CPR has compressed 18–25% from its 2023 peak as the market has matured and the remaining unidentified claimant pool has shrunk. Firms operating in Camp Lejeune successfully in 2026 are typically building robust referral pipelines through VFW posts, veterans' service organizations, and VA-affiliated medical providers in combination with paid acquisition.
AFFF (firefighting foam, PFAS cancer): $2,800 – $4,200 CPR
AFFF occupational-exposure claims target professional firefighters, military firefighting personnel, and industrial-site workers exposed to aqueous film-forming foam containing PFAS compounds. Qualifying criteria require documented occupational exposure plus a qualifying cancer diagnosis (testicular, kidney, or certain lymphomas depending on the MDL's current inclusion list). Signed rates run 9–14%.
AFFF is a case where TCPA compliance is particularly important because the claimant pool overlaps with active-duty military and retired-military populations that are heavily regulated under the Military Lending Act and related federal statutes. Firms buying non-compliant AFFF leads carry materially higher downstream litigation risk than firms buying non-compliant leads in consumer torts. The 15–25% premium for consent-verified AFFF leads is arguably more defensible than in any other active tort.
NEC (necrotizing enterocolitis, cow's milk formula): $3,100 – $4,800 CPR
NEC qualifying criteria are among the most technically specific of any active tort. Claimants must document that a premature infant received Similac or Enfamil cow's-milk-based formula (not breast milk or human-milk-based formula) during a specific neonatal window, and was subsequently diagnosed with NEC. Signed rates run 8–13%.
NEC qualification failure at medical-record review is the highest of any active tort — roughly 28–35% of signed retainers fail to file because documentation of formula brand, formula batch, or gestational age cannot be produced. Firms operating NEC successfully in 2026 are running Tier-2 medical-record pre-screening within 72 hours of initial retainer, which reduces filed-case falloff from the 28–35% baseline to 12–18%. The savings compound: a 20-point reduction in NEC falloff drops effective CPR from the upper-band $4,800 to roughly $3,400.
Hernia Mesh: $3,400 – $4,900 CPR
Hernia Mesh has been an active tort for years and MDL leadership has progressively narrowed criteria. Current qualifying criteria require specific hernia mesh device manufacturer/model, documented post-implant complication (migration, chronic pain requiring explant, infection), and specific documentation of surgical history. Signed rates run 9–14%.
The challenge with Hernia Mesh is that claimants often cannot recall the specific mesh manufacturer or device model, and retrieving that information from hospital records can take 60–90 days. Firms that pre-screen for implant documentation availability before signing retain the top-quartile claimants and push falloff to 12–15%. Firms that sign without pre-screening carry 22–28% falloff.
Bard PowerPort: $3,800 – $5,400 CPR
Bard PowerPort requires documented Bard PowerPort implant, documented fracture or migration of the device, and specific injury documentation (infection, internal injury, surgical removal). Signed rates run 8–12%. The specificity of the qualifying criteria — device model, fracture documentation, and specific injury — produces one of the highest qualification-failure rates at medical-record review (roughly 25–30%).
Strategic note: firms entering Bard PowerPort in 2026 should invest heavily in pre-screening the device-model question, because the wrong model can disqualify an entire cohort. Some firms have been signing claimants with implantable ports from other manufacturers on the assumption that criteria will broaden later — this has not happened and is unlikely to happen. Retained inventory from mis-qualified device-model claimants becomes unfilable cost.
Ozempic (GLP-1 agonist gastroparesis): $4,200 – $6,100 CPR
Ozempic is the newest high-volume tort in the benchmark table and qualifying criteria are still evolving. Current criteria require Ozempic or other GLP-1 agonist use plus a documented gastroparesis diagnosis (not simple nausea or GI discomfort). Signed rates run 7–11% — the low end reflects that many self-reporting claimants have GI symptoms that do not rise to gastroparesis on clinical evaluation.
MDL leadership has telegraphed further criteria narrowing in 2026, likely requiring specific GI-motility testing (gastric emptying scintigraphy) documented within a defined window of GLP-1 use. Firms anticipating that narrowing are pre-screening for motility testing at intake and refusing to sign claimants without documented testing. That pre-screening pushes signed volume down 30–40% but reduces falloff from the current 28% to 12–15%, improving effective CPR 18–22%.
Olympus Scope (CRE infection, MAJ-891 recall): $5,200 – $7,600 CPR
Olympus Scope is a high-CPR, high-value tort with the most demanding qualification criteria in the active benchmark. Claimants must document an Olympus scope procedure (typically ERCP, cystoscopy, ureteroscopy, or a procedure using the recalled MAJ-891 tubing set), plus a documented CRE or other qualifying bacterial infection within approximately 30 days, plus hospitalization records. Signed rates run 6–10%.
Olympus CPR is worth the investment because case values are unusually high — the Bigler bellwether verdict delivered $6.6 million plus $250,000 in concealment sanctions, and mass tort bellwether planning suggests average settlement values in the high six figures for serious CRE cases. Firms with medically-trained intake capable of navigating ERCP procedure records plus infection-diagnosis records typically outperform general-intake firms by 25–35% on Olympus signed rate.
Oxbryta (sickle cell disease): $5,800 – $8,400 CPR
Oxbryta is a post-withdrawal tort — Pfizer voluntarily withdrew voxelotor in September 2024 following safety concerns around vaso-occlusive crises and mortality signals. Qualifying criteria require documented Oxbryta use plus documented vaso-occlusive crisis hospitalization or wrongful death. Signed rates run 6–9%, reflecting both the narrow claimant pool and the demographic concentration of sickle cell disease patients.
Oxbryta is an example of a tort where paid-digital acquisition alone is inefficient and referral/community-outreach channels produce materially lower CPR. Firms building relationships with sickle cell disease advocacy organizations and hematology practices in the Southeast and mid-Atlantic typically operate at $4,000–$5,500 CPR — well below paid-digital-only firms.
PFAS personal injury (non-AFFF residential): $7,500 – $11,500 CPR
PFAS personal injury claims (distinct from AFFF occupational-exposure claims) are the highest-CPR active tort in the benchmark. Qualifying criteria require documented PFAS exposure through contaminated drinking water or consumer products plus a specific PFAS-linked cancer or disease diagnosis. Signed rates run 4–8% — the lowest of any active tort — because the qualifying criteria require both exposure documentation and highly specific medical documentation.
PFAS personal injury is a specialty tort. Firms operating it successfully are usually geographically focused on known-contamination zones (specific PFAS-impacted water districts, specific consumer-product batches) rather than running national campaigns. A geographically-targeted PFAS campaign in a confirmed contamination zone can achieve CPR 30–40% below the national PFAS benchmark; a national PFAS campaign rarely achieves the upper-band benchmark.
Four real case studies: CPR reduction in practice
The following four case studies are drawn from Mass Tort Agency's 2025 client book, anonymized at the clients' request but otherwise unmodified. Each illustrates a different operational lever that produced meaningful CPR reduction without increasing ad spend or changing vendor mix.
Case study 1: Southeast PI firm — intake speed produces 41% CPR reduction
In Q3 2025, a Southeast-based PI firm running Hair Relaxer, Depo Provera, and Suboxone campaigns came to us with a blended CPR of $3,840 — dead center on the industry median, and roughly 70% above the low end of the benchmark range for their mix. Their vendor spend was $186,000 that quarter; they signed 48 qualified retainers.
The diagnostic revealed three issues, none of which were vendor-related. First, median response time of 38 minutes — intake specialists were working a shared queue with no SLA enforcement, and 62% of leads waited longer than 15 minutes. Second, average touch count of 2.4 attempts per lead, with 71% of leads receiving fewer than 4 attempts total. Third, no post-sign retention protocol — falloff rate was 27%, nearly double the benchmark.
We worked with the firm on three operational changes in Q4 2025. A 5-minute response SLA enforced at the CRM level, which automatically escalated uncontacted leads to the next available specialist. A standardized 7-touch cadence template that blocked specialists from closing a lead before the required touches were completed. A 48-hour post-sign welcome-call protocol targeting the 30-day falloff window, executed by a retention specialist separate from the intake team.
No change to vendor mix. No change to ad spend. Q1 2026 results: blended CPR dropped to $2,265, a 41% reduction. Spend was flat at $188,000. Signed retainers increased from 48 to 83. Falloff dropped from 27% to 12%. The entire improvement came from intake operations — the same data we had been flagging publicly for three years. Annualized, the intervention delivered approximately $500,000 of effective ad-spend savings at constant vendor contracts.
Case study 2: Midwestern firm — vendor-matrix reallocation produces 28% CPR reduction
A four-attorney firm in Chicago running Camp Lejeune, Roundup, and AFFF campaigns through three vendors had a blended Q3 2025 CPR of $3,150 — on-benchmark for their tort mix. Their diagnostic problem was vendor-blind allocation: they were splitting spend roughly evenly across the three vendors on each tort.
When we ran the vendor-by-tort CPR matrix, the pattern was stark. Vendor A delivered $2,100 CPR on Roundup, $4,800 on Camp Lejeune, $3,400 on AFFF. Vendor B delivered $3,400 on all three. Vendor C delivered $2,800 on AFFF, $2,600 on Camp Lejeune, but refused to quote on Roundup. The firm was paying above-market on Vendor A for Camp Lejeune and below-market on Vendor C for AFFF, canceling out to a roughly average blended outcome that hid both the wins and the losses.
The reallocation moved Roundup 100% to Vendor A, Camp Lejeune 100% to Vendor C, AFFF 70% to Vendor C and 30% to Vendor A. Vendor B was retained as a backup with 5% of total spend for optionality. Q1 2026 blended CPR: $2,270, a 28% reduction. No new vendors, no ad-spend change, no intake changes. Just allocation discipline on the vendor-tort matrix.
Case study 3: Multi-state firm — falloff protocol produces 19% CPR reduction
A 12-attorney firm operating across Florida, Georgia, and Alabama was running Hair Relaxer, NEC, and Bard PowerPort. Blended Q4 2025 CPR was $3,620 with falloff running 26%. The firm had strong intake speed (median 4 minutes) and competitive vendor pricing. The issue was entirely at the falloff stage.
We designed a three-stage post-sign retention protocol. Stage one: within 48 hours of retainer, a welcome call from a dedicated retention specialist (not from intake) covering case expectations, next steps, and medical-record retrieval timeline. Stage two: weekly automated status update SMS during the medical-record retrieval period. Stage three: 30-day check-in call confirming claimant engagement and addressing any concerns. Each stage was tracked in the CRM with escalation to the intake supervisor if a claimant was unreachable for 14 consecutive days.
Q1 2026 results: falloff dropped from 26% to 11%. Blended CPR dropped to $2,930, a 19% reduction. The retention protocol added approximately $8 of cost per retainer (retention specialist time plus SMS costs), which was a tiny fraction of the $690 CPR savings. Annualized, the protocol delivered roughly $380,000 of effective savings against a $22,000 annual cost of the retention specialist program.
Case study 4: Solo attorney first campaign — budget discipline produces on-benchmark Q1 CPR
A solo PI attorney in Texas entered mass tort for the first time in October 2025 with a 90-day Hair Relaxer campaign budget of $55,000. The attorney had no in-house intake team and no mass tort case management system. We recommended against self-servicing intake given the small scale and instead directed the attorney to a third-party intake operator with experience in Hair Relaxer.
Budget allocation: $38,000 to exclusive Hair Relaxer leads via Mass Tort Agency, $9,500 to third-party intake services, $3,500 to a minimal CRM setup (Lead Docket), $2,500 to medical record retrieval, $1,500 contingency. First 90 days: 340 leads purchased, 58 signed retainers, 7 falloffs in 30-day window, 51 filed cases. CPR on filed cases: $1,078, right at the low end of the Hair Relaxer benchmark range. Signed rate of 17%, above the benchmark median.
The lesson from this case study is not operational but strategic. A solo attorney entering mass tort for the first time usually overestimates the value of “doing it themselves” and underestimates the cost of intake errors during the learning curve. Buying intake capacity for the first 6–9 months — then bringing it in-house once the attorney has cohort data and operational experience — typically produces 20–35% better first-year CPR than self-servicing intake from day one.
The vendor evaluation framework: a 14-question RFP for 2026
Most firms evaluate mass tort vendors on price alone, with occasional reference to reputation or prior-firm relationships. That approach misses most of what matters. Below is the structured RFP framework we recommend every firm use when evaluating a new vendor or renegotiating an existing contract. Each question is designed to surface a specific risk or performance variable that shows up in downstream CPR.
- What is your source structure? Direct-to-source (you own the publisher), network-sourced (you broker across partner publishers), or aggregator (you re-sell). Direct-to-source vendors typically deliver 15–30% lower CPR at the same sticker price.
- What TCPA infrastructure do you use? TrustedForm certified, Jornaya LeadID, proprietary consent capture, or none. Any answer short of TrustedForm or Jornaya is a risk flag.
- What is your one-to-one consent posture post-IMC v. FCC? Vendors that rebuilt one-to-one consent before January 2025 but did not dismantle it afterward are the safest. Vendors that aggressively rolled back consent infrastructure after the vacatur are a risk flag.
- Will you quote on CPR or only on CPL? Vendors confident in their quality will quote CPR ceilings or retainer-rate guarantees. Vendors that refuse are signaling uncertainty about their own lead quality.
- What is your typical lead-to-signed rate on this tort with a reference client? Ask for a specific client reference with permission to call. Vendors that cannot produce this are likely inflating their performance claims.
- What is your lead exclusivity period? Exclusive leads should be exclusive for at least 30 days. “Exclusive” leads sold as “exclusive for 48 hours” and then re-sold are not exclusive in any meaningful sense.
- How do you handle lead returns/disputes? A legitimate vendor accepts returns on leads that fail disqualifying-criteria screens within 24–72 hours. Vendors that refuse returns are capping your recourse and effectively overcharging on marginal inventory.
- What is your audit process for lead quality? Ask for their internal QC documentation. Vendors that run weekly call-back QC on a sample of sold leads deliver measurably higher quality than vendors that rely solely on post-hoc firm feedback.
- What creative do you use and can we see samples? Creative drives lead quality. Vendors running misleading or emotionally manipulative creative produce higher CPL but lower signed rate — and sometimes regulatory risk for your firm.
- What is your geographic coverage and can you target by state/DMA? National-only vendors often over-deliver in low-value markets and under-deliver in high-value markets. State-level or DMA-level targeting is now table stakes.
- What is your data-retention policy and how do you respond to subpoenas? In the event of TCPA or state-bar investigation, you need a vendor who can produce consent records on demand. Vendors with ambiguous data-retention policies are a compliance risk.
- Will you provide source URL or source publisher name on each lead? Vendors that refuse to disclose source are usually obscuring quality or compliance problems. Premium vendors disclose source at the per-lead level.
- What is your reference client's tenure with you? Vendors who can produce a reference client with a 3+ year tenure are telegraphing long-run quality. Vendors whose oldest reference client is under 12 months are often high-churn operators.
- What is your bankruptcy/continuity posture? The legal-lead industry has had several significant vendor failures in the past three years. A vendor that carries commercial insurance, has demonstrable capital reserves, and can explain its continuity plan is lower-risk than one that cannot.
Run this RFP against every vendor in your current stack. Vendors that cannot answer 11 of the 14 questions without deflection are not premium-tier vendors, regardless of what they quote. The RFP also functions as a negotiation lever; vendors who score well on the framework will often accept CPR-ceiling pricing to avoid losing the business, while low-scoring vendors will not.
Compliance deep dive: TCPA, DPPA, and state-bar considerations in 2026
Compliance is now a material driver of CPR both because compliant leads cost more at the wholesale level and because non-compliant acquisition carries large downstream costs that affect effective CPR when factored in. Three regulatory regimes matter most in 2026: the TCPA, the DPPA (for motor-vehicle-linked claimant data), and state-bar advertising rules.
TCPA in 2026: post-IMC v. FCC posture
The Eleventh Circuit's January 2025 decision in Insurance Marketing Coalition v. FCCvacated the FCC's one-to-one consent rule before it took effect. That decision removed the immediate regulatory mandate to rebuild consent flows around one-to-one attestation. However, TCPA plaintiff-side litigation continues at pre-rule volumes, state-level consent statutes (Florida, Oklahoma, Washington) impose stricter requirements than federal TCPA, and leading ad platforms (Meta, Google) still enforce consent-quality requirements for legal-vertical advertisers.
Practical implications for firms buying leads in 2026. First, every inbound call or SMS to a lead should be traceable to a specific consent interaction with a producible record. Second, firms should require vendors to provide consent records on demand within 24 hours of request, with 90-day record retention minimum. Third, firms should maintain their own secondary record of consent provenance in the CRM, separate from the vendor's records, so that consent chain of custody survives any vendor-side issue. Fourth, firms should train intake specialists to verify consent verbally at the top of the first call (“I'm following up on the form you submitted — is that correct?”) and document the verification in the CRM note.
DPPA implications for MVA-adjacent mass tort leads
The Driver's Privacy Protection Act governs the acquisition and use of motor vehicle record data. MVA-adjacent torts (Rideshare, commercial trucking accidents) and some products torts (auto-recall related) involve lead sources that occasionally include DMV-originated data. Firms should explicitly confirm with vendors that no DPPA-restricted data is being used in targeting or enrichment. DPPA violations are federally enforceable and carry statutory damages of $2,500 per violation per claimant, which can rapidly exceed the entire value of a lead program.
State-bar advertising compliance
Four states maintain advertising review regimes that directly affect mass tort lead programs. Florida requires pre-review or concurrent-review of most electronic advertising under Rule 4-7.19. New York requires compliance with 22 NYCRR Part 1200, including specific disclosures for mass tort solicitation. Texas requires state-bar review of advertising and specific disclosures for contingency-fee matters. California has less formal pre-review but enforces against deceptive advertising aggressively.
Firms running multi-state campaigns should budget $400–$1,200 per quarter for state-bar compliance review, maintain a library of pre-approved creative, and build a workflow to flag new creative for state-bar-specific review before deployment. Vendors that run their own compliance review typically charge a premium but eliminate the internal workflow cost; firms should evaluate whether the premium is net-positive relative to their own compliance capacity.
Federal and state consumer-protection overlays
Beyond TCPA, DPPA, and state-bar rules, firms should monitor FTC Section 5 enforcement on deceptive advertising, state UDAP statutes (unfair and deceptive acts and practices), and the growing patchwork of state privacy statutes (CCPA, CPRA, VCDPA, CPA, UCPA, CTDPA, OCPA). The practical effect of the state-privacy patchwork is that vendors must implement consumer-rights handling (access, deletion, opt-out) for claimant data, and firms should confirm that vendors have this infrastructure before purchasing. A vendor that cannot respond to a claimant deletion request in the statutory window creates direct liability exposure for the purchasing firm.
Compliance-first mass tort leads
Every lead we deliver is TCPA consent-verified via TrustedForm, state-bar-compliant across our covered jurisdictions, and DPPA-clean. Talk to an account executive about your tort and your state footprint.
See Compliant Lead ProgramsROI modeling: from CPR to settlement disbursement
CPR is the input; settlement economics are the output. A firm that doesn't model the full path from CPR to disbursement is operating on partial information. The below model is the framework we use with clients to evaluate portfolio decisions.
The six-variable CPR-to-disbursement model
The model requires six inputs. CPR: cost per signed retainer that survives 30-day falloff. File rate: percentage of retained cases that ultimately file. Settlement rate: percentage of filed cases that settle (as opposed to being voluntarily dismissed or otherwise resolved without recovery). Average gross settlement: mean settlement amount before fees and costs. Contingency rate: your firm's contingency percentage. Cost structure: lien, med-record, co-counsel, and expense load.
For a representative Depo Provera program: CPR $2,600, file rate 88%, settlement rate 92%, average gross settlement $175,000, contingency 40%, cost structure 18%. Calculation: per 100 retained cases, 88 file, 81 settle. Gross fees: 81 × $175,000 × 40% = $5,670,000. Cost load: $5,670,000 × 18% = $1,020,600. Net fees to firm: $4,649,400. Total CPR spend: 100 × $2,600 = $260,000. Net ROI multiple: $4,649,400 / $260,000 = 17.9x gross; net of cost load, roughly 15.5x.
Now stress-test the model by moving each variable. If CPR increases 20% to $3,120, ROI drops to 14.9x — still strong. If signed-rate-to-filed rate drops 10 points to 78%, ROI drops to 12.5x — meaningful. If average gross settlement drops 15% to $148,750, ROI drops to 13.2x — also meaningful. The single most sensitive variable is average gross settlement, which tells you that winning the litigation strategy matters at least as much as winning the acquisition efficiency game. Firms that focus solely on CPR without investing in case quality and litigation posture leave the largest lever unpulled.
Payback timing and working capital
CPR is spent in real time; settlement disbursement arrives 18–42 months later depending on tort maturity. The capital cycle matters because firms that cannot finance the gap must either restrict scale or accept litigation funding at 15–25% of recovery. A firm running $500,000 in quarterly CPR spend is carrying $1.5–$3.0M of unrecovered acquisition cost at any given steady-state moment. Working capital planning is as important as CPR optimization for firms scaling mass tort portfolios.
Portfolio construction: blending short-cycle and long-cycle torts
A well-constructed mass tort portfolio blends short-cycle torts (Camp Lejeune, Roundup — settlements arriving at scale now) with mid-cycle torts (Hair Relaxer, Depo Provera — settlements expected 2027–2028) and long-cycle torts (Olympus Scope, Bard PowerPort — settlements likely 2028–2030). The blend smooths cash flow and reduces variance. Firms concentrated entirely in long-cycle torts carry elevated working-capital risk; firms concentrated entirely in short-cycle torts surrender the higher expected returns on mid- and long-cycle matters.
Geographic pricing: how CPR varies by state and metro
Geography affects CPR through three levers: CPM density (urban metros run 20–40% higher Meta and Google CPMs than secondary markets), qualifying-claimant population density (affects absolute volume and therefore vendor competition), and state-specific legal-marketing rules (Florida's 30-day solicitation rule, New York's IOLTA compliance, Texas's state bar advertising review).
Premium-CPR markets: New York, Los Angeles, Chicago, Miami
The four premium-CPR markets push lead prices 30–55% above national benchmarks. CPMs on Meta in these markets can exceed $22 on legal-vertical audiences, compared to $9–$14 in secondary markets. New York adds specific complications: the Notice of Claim rule for any municipal-defendant matter requires 90-day filing, which drives more aggressive intake speed; state-bar Part 1200 advertising rules add compliance overhead; and NYC DMA includes several boroughs with claimant demographics that convert below borough-specific expectations. Los Angeles has similar CPM pressure plus specific California consumer-protection overlays. Chicago and Miami add litigation-center economics where multiple large firms compete for the same inventory.
Strategic implication: firms entering premium markets should do so only after their intake operation is proven at below-benchmark CPR in secondary markets. Premium-market CPR punishes intake weakness more aggressively because the baseline CPL is higher, meaning every percentage point of signed-rate weakness has a larger absolute cost.
Secondary markets: Atlanta, Dallas, Phoenix, Tampa, Nashville
Secondary markets typically offer CPR 15–30% below national benchmarks with competitive qualifying-claimant populations. These markets are where new mass tort programs should launch because cohort data is cheaper to generate per signed retainer. An Atlanta-based Hair Relaxer campaign can often operate at $1,150 CPR when a New York-based Hair Relaxer campaign is at $1,800. The underlying claimant qualifies identically; the market efficiency is in the acquisition cost.
Tertiary markets and rural exposure
Rural and small-metro markets (sub-200,000 population) can deliver extremely low CPLs but often suffer from intake-speed friction because claimants are geographically distributed, and from signed-rate friction because demographic profiles sometimes correlate with lower conversion. Firms operating successfully in tertiary markets typically use specialty vendors with local-publisher networks rather than national digital acquisition. CPR in tertiary markets can be 20–40% below national benchmarks but requires specific vendor relationships.
State-specific regulatory CPR premiums
Three states impose meaningful regulatory premiums on mass tort acquisition. Florida's 30-day solicitation rule (Rule 4-7.18) prohibits direct solicitation of prospective clients within 30 days of an injury or death event. This pushes Florida firms toward inbound-digital-only acquisition, which has different cost economics than multi-channel acquisition. Nevada restricts certain forms of direct solicitation under its state bar rules. Puerto Rico imposes significant consumer-protection overlays. Firms operating in these jurisdictions should build compliant acquisition workflows specifically for those states rather than pushing national workflows through a regulatory screen.
What the next 12 months look like: 2026 predictions
The following predictions reflect our working model for 2026 as of Q2. Each prediction has directional implications for firms planning capital allocation, vendor contracts, and intake staffing. We assign confidence levels to each; higher-confidence predictions are supported by leading-indicator data from our Q1 book, while lower-confidence predictions reflect pattern-matching to prior-cycle market behavior.
High-confidence predictions
- CPR compression in the low-volume, high-qualification tier. As PFAS and Olympus Scope MDLs mature and inventories build, vendor competition should reduce CPR in that tier 8–15% by Q4 2026. (Confidence: high.)
- CPR inflation in the consumer/volume tier. Rideshare and Hair Relaxer are attracting new entrants and more aggressive digital bidding. Expect 10–18% CPR inflation by year-end. (Confidence: high.)
- AI-assisted intake becomes table stakes. Firms piloting AI-driven first-contact screeners are reporting 12–18% improvements in signed rate and near-instant response times. Expect widespread adoption by Q3 2026; firms that don't deploy it will carry a structural 10–15% CPR disadvantage by year-end. (Confidence: high.)
Medium-confidence predictions
- Two to three new torts emerge at scale. Watch forever-chemical consumer products, GLP-1 mental health claims, and continued expansion of Bard vascular device litigation. First-mover CPR on a new tort at launch is typically 50–70% of steady-state CPR twelve months later. (Confidence: medium.)
- TCPA enforcement activity increases in second half of 2026. Plaintiff-side TCPA firms have been accumulating leads through 2025; expect filing volume to rise in Q3–Q4. Firms with weak consent chains will face meaningful exposure. (Confidence: medium-high.)
- State-bar advertising enforcement tightens. Florida and California state bars have signaled increased enforcement against mass tort advertising practices; expect specific enforcement actions against non-compliant operators. (Confidence: medium.)
Lower-confidence predictions
- One major lead-vendor consolidation transaction. The legal lead-vendor space has been maturing; expect at least one significant M&A event (vendor-vendor or legal-tech-vendor acquisition) in 2026. (Confidence: medium-low.)
- First successful CPR-ceiling pricing norm at scale. Multiple firms will push premium vendors to CPR-ceiling or retainer-rate-guarantee contracts. Expect this to become a standard negotiation point by Q4. (Confidence: medium.)
- Settlement disbursement acceleration in at least one major tort. MDL leadership across several torts is signaling interest in bellwether acceleration. Expect at least one significant settlement disbursement event in 2026 that meaningfully affects working-capital dynamics across the plaintiffs' bar. (Confidence: low-medium.)
Implementation: your 30-day plan to beat the 2026 CPR benchmark
The following 30-day plan is the exact sequence we walk client firms through when they engage us for a CPR-reduction consultation. Each day has a specific deliverable, a specific owner, and a specific measurement. Firms that complete the full 30-day sequence typically see a 20–35% CPR reduction within one full quarter, with no change in vendor mix or ad budget.
Week 1: Measurement and diagnostic
Days 1–3: Pull 90 days of vendor spend and retained retainers by tort. Compute actual CPR per vendor per tort. Identify outliers against the 2026 benchmark table. Owner: marketing partner or operations director. Deliverable: a vendor-tort CPR matrix showing your firm's performance versus benchmark.
Days 4–7: Audit intake response time. Pull timestamps from your CRM for the same 90-day period. Compute median and 90th-percentile response times by specialist, day-of-week, and hour-of-day. If median is above 10 minutes, flag this as your highest-ROI intervention. Owner: intake supervisor. Deliverable: intake response-time report with specialist-level detail.
Week 2: Intake operational fixes
Days 8–10: Implement a 5-minute response SLA. Configure your CRM to auto-escalate uncontacted leads to the next available specialist at the 5-minute mark. Configure automated SMS on inbound form submission within 30 seconds. Owner: CRM administrator plus intake supervisor. Deliverable: enforced SLA with measurable compliance.
Days 11–14: Deploy a 7-touch cadence template. Enforce the template at the CRM level so that specialists cannot close leads before the required touches are completed. Train intake specialists on the cadence structure and objection handling. Owner: intake supervisor plus cadence trainer. Deliverable: training completion for all intake staff plus system-level enforcement.
Week 3: Vendor and allocation fixes
Days 15–17: Renegotiate vendor contracts where your CPR is 35%+ above benchmark. Ask for retainer-rate guarantees or CPR-ceiling pricing. Drop vendors that refuse to engage. Owner: managing partner or marketing partner. Deliverable: renegotiated contracts with at least your top-three vendors.
Days 18–21: Rebalance vendor allocation across torts based on the vendor-tort CPR matrix from Week 1. Shift spend toward high-performing vendor-tort combinations and away from underperforming ones. Owner: marketing partner. Deliverable: updated allocation plan with documented rationale.
Week 4: Falloff and retention protocol
Days 22–24: Implement a 48-hour post-sign welcome call protocol. Assign a retention specialist (can be part-time or shared) separate from the intake team. Train the retention specialist on case expectations and medical-record retrieval timeline communication. Owner: intake supervisor. Deliverable: functioning welcome-call workflow with CRM integration.
Days 25–28: Deploy weekly automated status update SMS during medical-record retrieval, plus a 30-day check-in call. Escalate unreachable claimants at 14 consecutive days. Owner: retention specialist plus CRM administrator. Deliverable: documented retention protocol with measurable falloff pre- and post-intervention.
Days 29–30: Deploy performance reporting. Build a dashboard showing CPR, signed rate, falloff rate, and touch count by vendor, tort, specialist, day-of-week, and hour-of-day. Schedule weekly review with the firm leadership team. Owner: operations director. Deliverable: live dashboard plus weekly review cadence.
Expected outcomes at day 90
Firms that complete the 30-day plan and maintain the operational improvements typically see the following outcomes by day 90. Median response time: under 5 minutes (from a typical starting point of 18–25 minutes). Signed rate: 15–20% higher than baseline. Falloff rate: 10–14% versus a baseline of 22–28%. Blended CPR: 20–35% below the baseline. Capacity headroom: 25–40% more lead volume can be processed at the new signed-rate baseline without hiring.
Further reading
- Mass Tort Intake: The Complete Guide to Screening, Qualifying, and Signing Claimants at Scale — a deeper dive into the intake operational playbook referenced throughout this article.
- Motor Vehicle Accident Leads for Attorneys: A 2026 Procurement, Pricing, and ROI Guide — the MVA counterpart to this mass tort CPR analysis.
- How to Maximize ROI on Mass Tort Campaigns — portfolio construction and working-capital planning for multi-tort firms.
- Mass Tort Law Firm SEO: The Definitive Guide to Dominating Organic Search in 2026 — organic acquisition as a CPR-reduction lever over the 12–24 month horizon.
- AEO for Personal Injury Lawyers — positioning your firm for answer-engine surfaces as AI search reshapes discovery.
- Olympus Scope Lawsuit: Duodenoscope, CRE Superbug, and MAJ-891 Recall Litigation Guide for Attorneys — tort-specific deep dive for one of the highest-value matters in the 2026 benchmark.
- Mass Tort Marketing Glossary — 150+ defined terms referenced throughout this article.
Sources and methodology
All CPR benchmark ranges in this article are drawn from anonymized Q1 2026 performance data across Mass Tort Agency's active client book, cross-referenced against published industry surveys and practitioner-disclosed benchmarks. The client book includes roughly 140 active plaintiff-side firms representing approximately $180M of annual mass tort lead spend across 16 active tort categories. Benchmarks are computed as interquartile ranges after removing outliers above the 95th percentile and below the 5th percentile, to avoid distortion from either catastrophically underperforming or anomalously high-performing campaigns.
Digital CPM inflation figures reference Meta Ads Manager and Google Local Services Ads public-disclosure data for Q4 2024 through Q1 2026, segmented to legal-vertical audiences. TCPA analysis references Insurance Marketing Coalition v. FCC (11th Cir. January 2025) and tracks subsequent FCC guidance and state-level statutory developments through April 2026. State-bar compliance references current Florida Rule 4-7.19, New York 22 NYCRR Part 1200, Texas Disciplinary Rules of Professional Conduct advertising provisions, and California Rules of Professional Conduct as of Q1 2026.
Intake response-time conversion data is consistent with the original InsideSales/MIT Lead Response Management Study and Harvard Business Review subsequent findings, adjusted for legal-vertical conversion dynamics observed across our client base. The 7-touch cadence framework reflects industry-standard practice across legal-intake operators, with our client data providing specific signed-rate attribution at each cadence step. Case study figures are real but have been scaled and anonymized at the clients' request; identifying details have been modified to protect client confidentiality while preserving the operational mechanics of each intervention.
AI-assisted intake performance data is drawn from pilot deployments within our client book and from public disclosures by intake-technology vendors (Captorra, CaseSyntax, Lead Docket, plus three unnamed AI-voice-agent providers). These figures should be treated as early-stage and likely to shift as adoption broadens and vendor-level performance stabilizes. We will update this article with refreshed benchmarks each quarter; the dateModified field in the structured data reflects the most recent refresh.
If your firm would like a confidential benchmarking report comparing your actual CPR performance against the 2026 national ranges in this article, we offer a one-page analysis at no cost based on 90 days of your vendor-spend and retained-retainer data. The report includes your CPR position versus benchmark for each tort in your portfolio, the three highest-leverage operational interventions given your starting point, and a scoped 30-day plan consistent with the framework in this article.
Benchmark your real CPR against the 2026 table
Send us your last-90-days mass tort spend and we'll produce a one-page CPR benchmark report comparing your numbers to the 2026 national ranges — no commitment, no pitch deck.
Request CPR Benchmark Report